21 Apr 2017
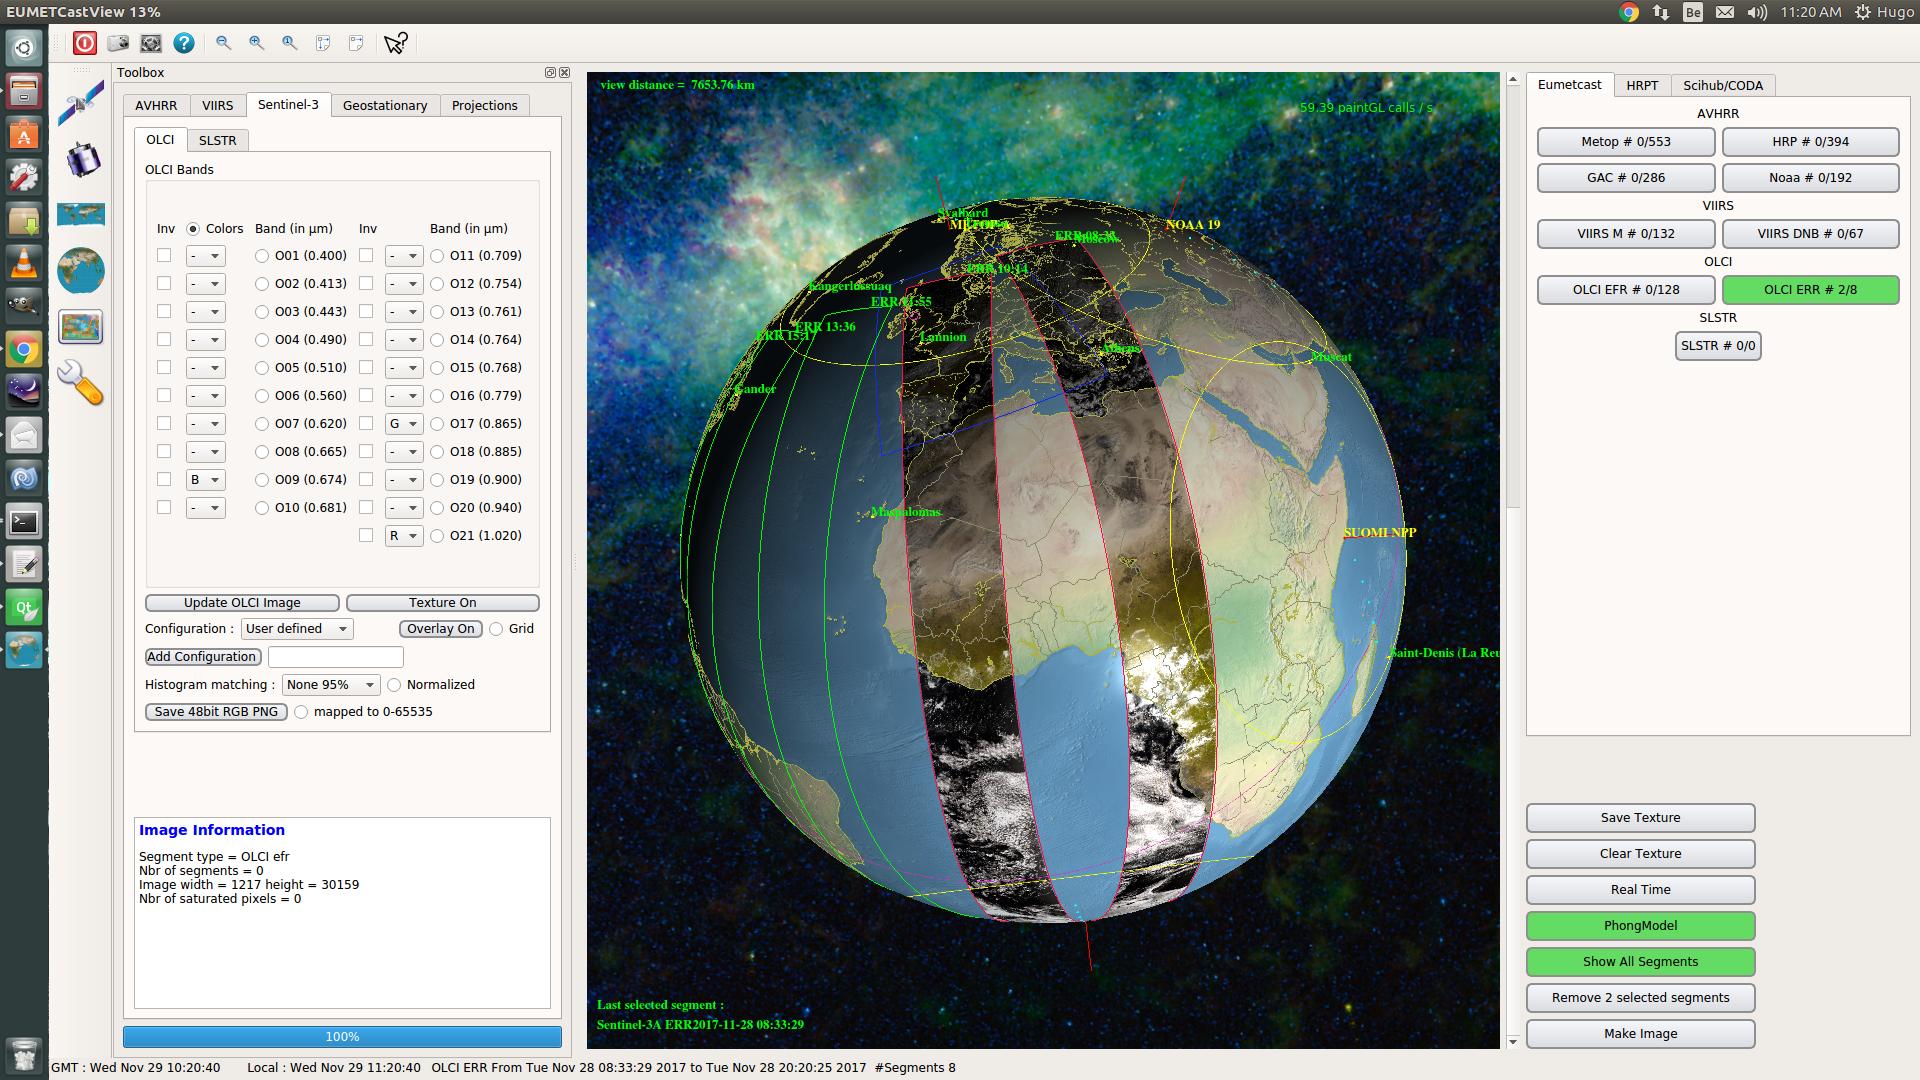
In release v1.2.4 it was already possible to save OLCI EFR/ERR segments as a 48bit RGB PNG image. In this release you can save the projection image (for the Lambert, the vertical and the Stereographic projection) for the OLCI EFR/ERR and VIIRS M as a 64bit RGBA PNG image. The internal calculations for the projected image are done with the maximum precision of 12 bits, because the bit depth of the OLCI and VIIRS sensor are 12 bits. If the projected image contains pixels that where not valid or the segments didn’t cover the complete projected image, the Alpha value of such pixels are zero. Image processing software (like Gimp 2.9.5 or Photoshop) can use this feature to process the image. A radiobutton ‘mapped to 0 - 65535’ multiplies every pixel value by 16.
Download it at Github.
06 Apr 2017
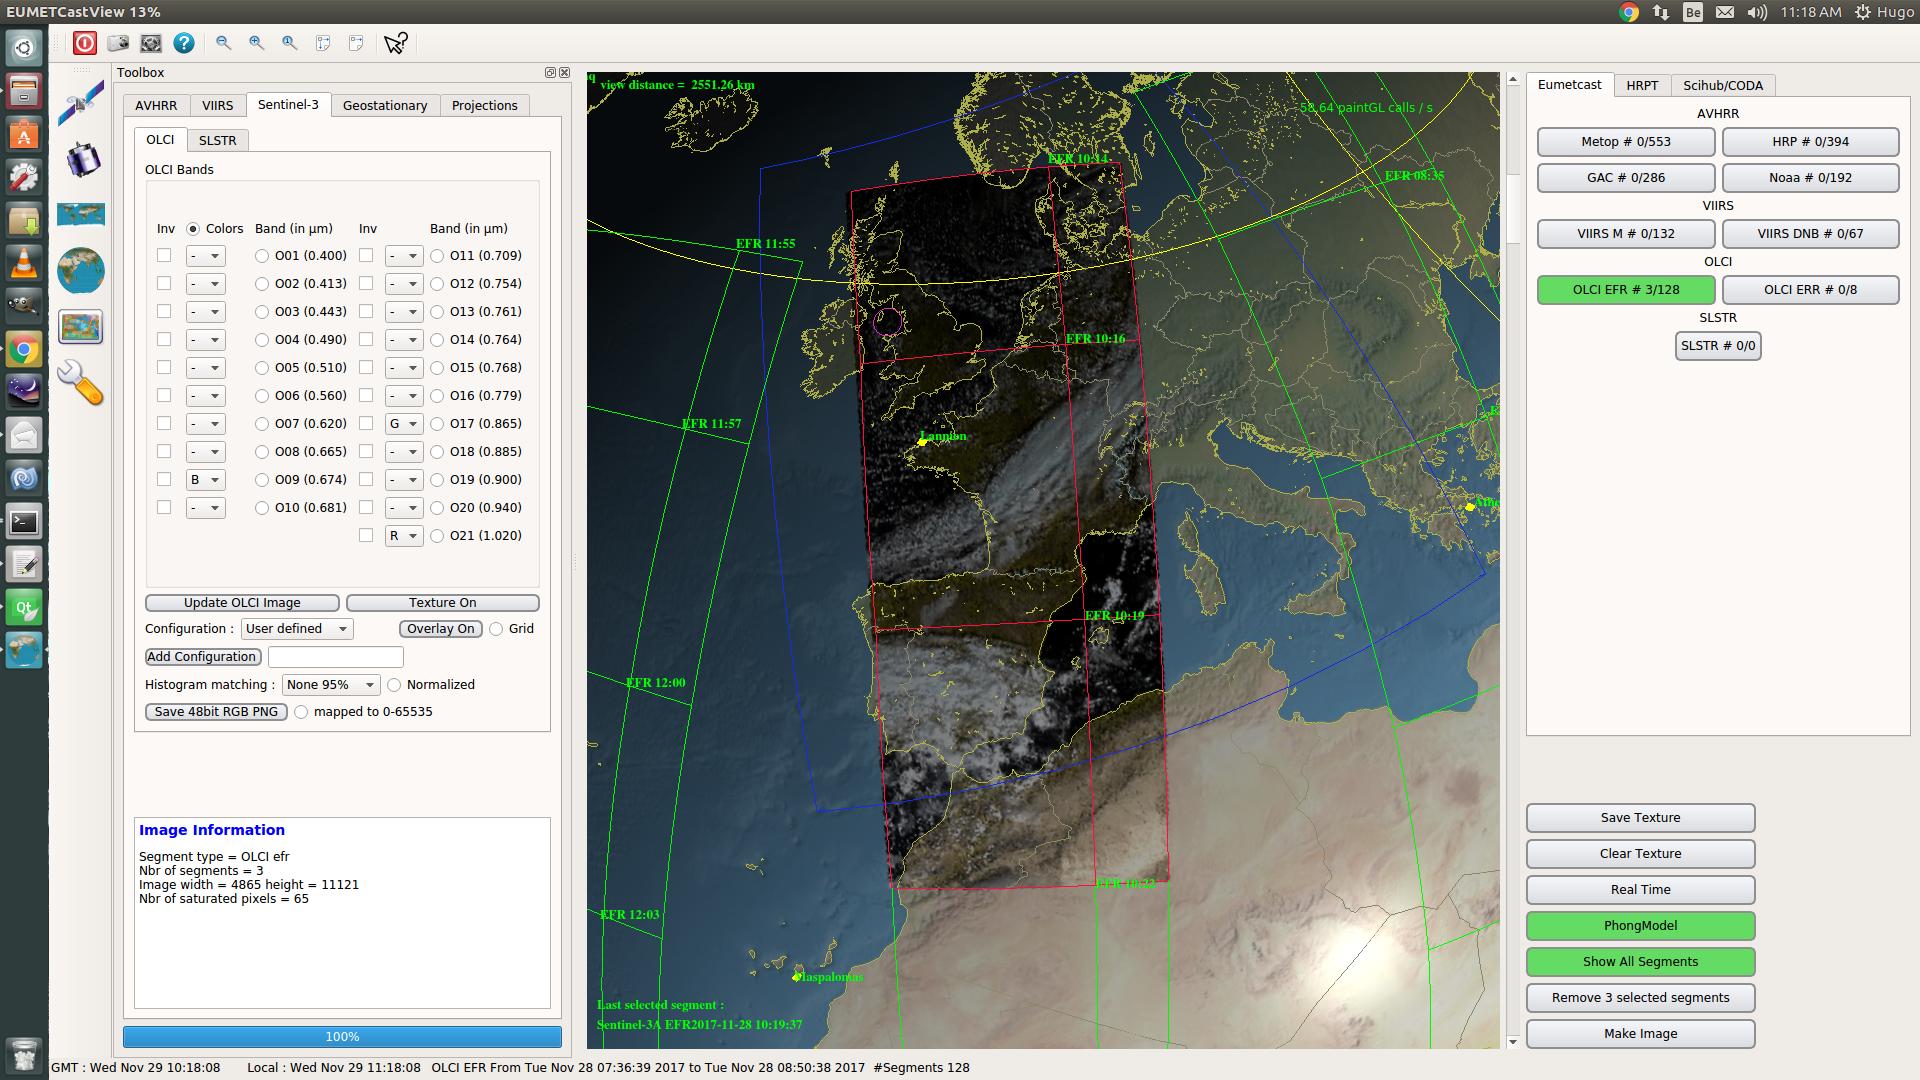
In release v1.2.4 the download of OLCI EFR/ERR and SLSTR segments from Scihub or CODA is integrated in EUMETCastView.
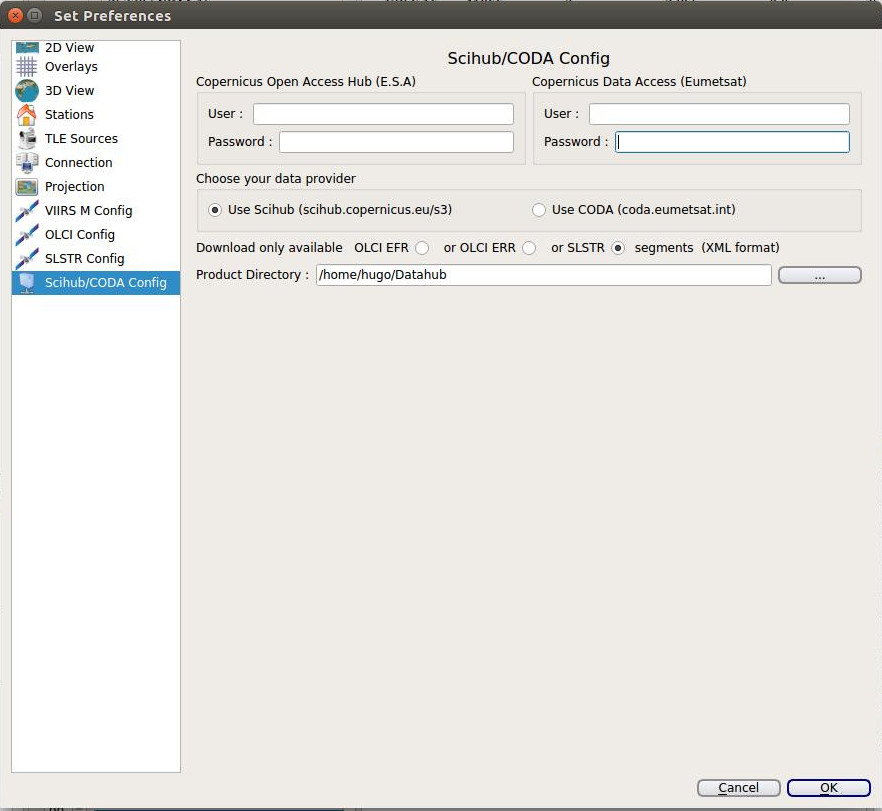
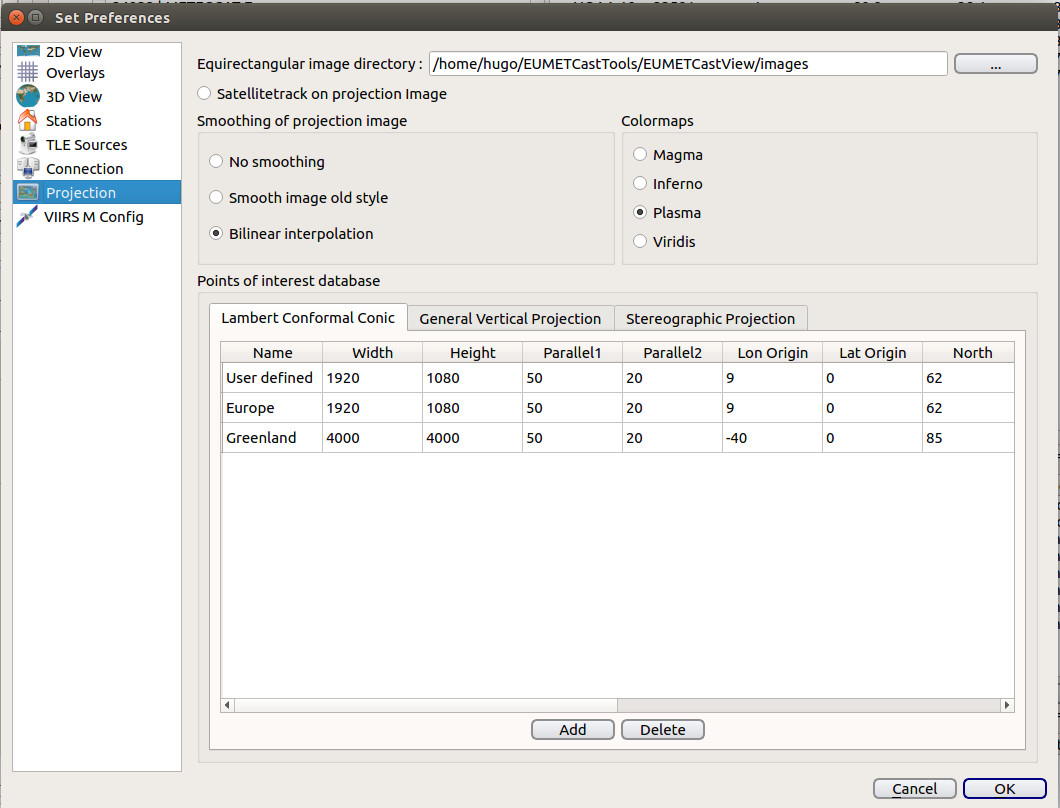
The first thing to do is entering your userid and password for the Scihub or CODA website in ‘Set Preferences’ - ‘Scihub/CODA Config’ window. Choose your data provider and indicate in which kind of image your interested. The Scihub/CODA websites contains all the OLCI EFR/ERR and SLSTR segments. The downloaded products are saved in the ‘Product Directory’.
- The Preferences window for Scihub/CODA Config.
For downloading the available segments, choose the date in the calendar, go to the 3D Globe and push the ‘Download available segments from Scihub/CODA’ button. An XML file will be created, and you can see the progress of the download on the 3D-Globe window. Once the download is complete, all the available segments are displayed on the 3D-Globe.
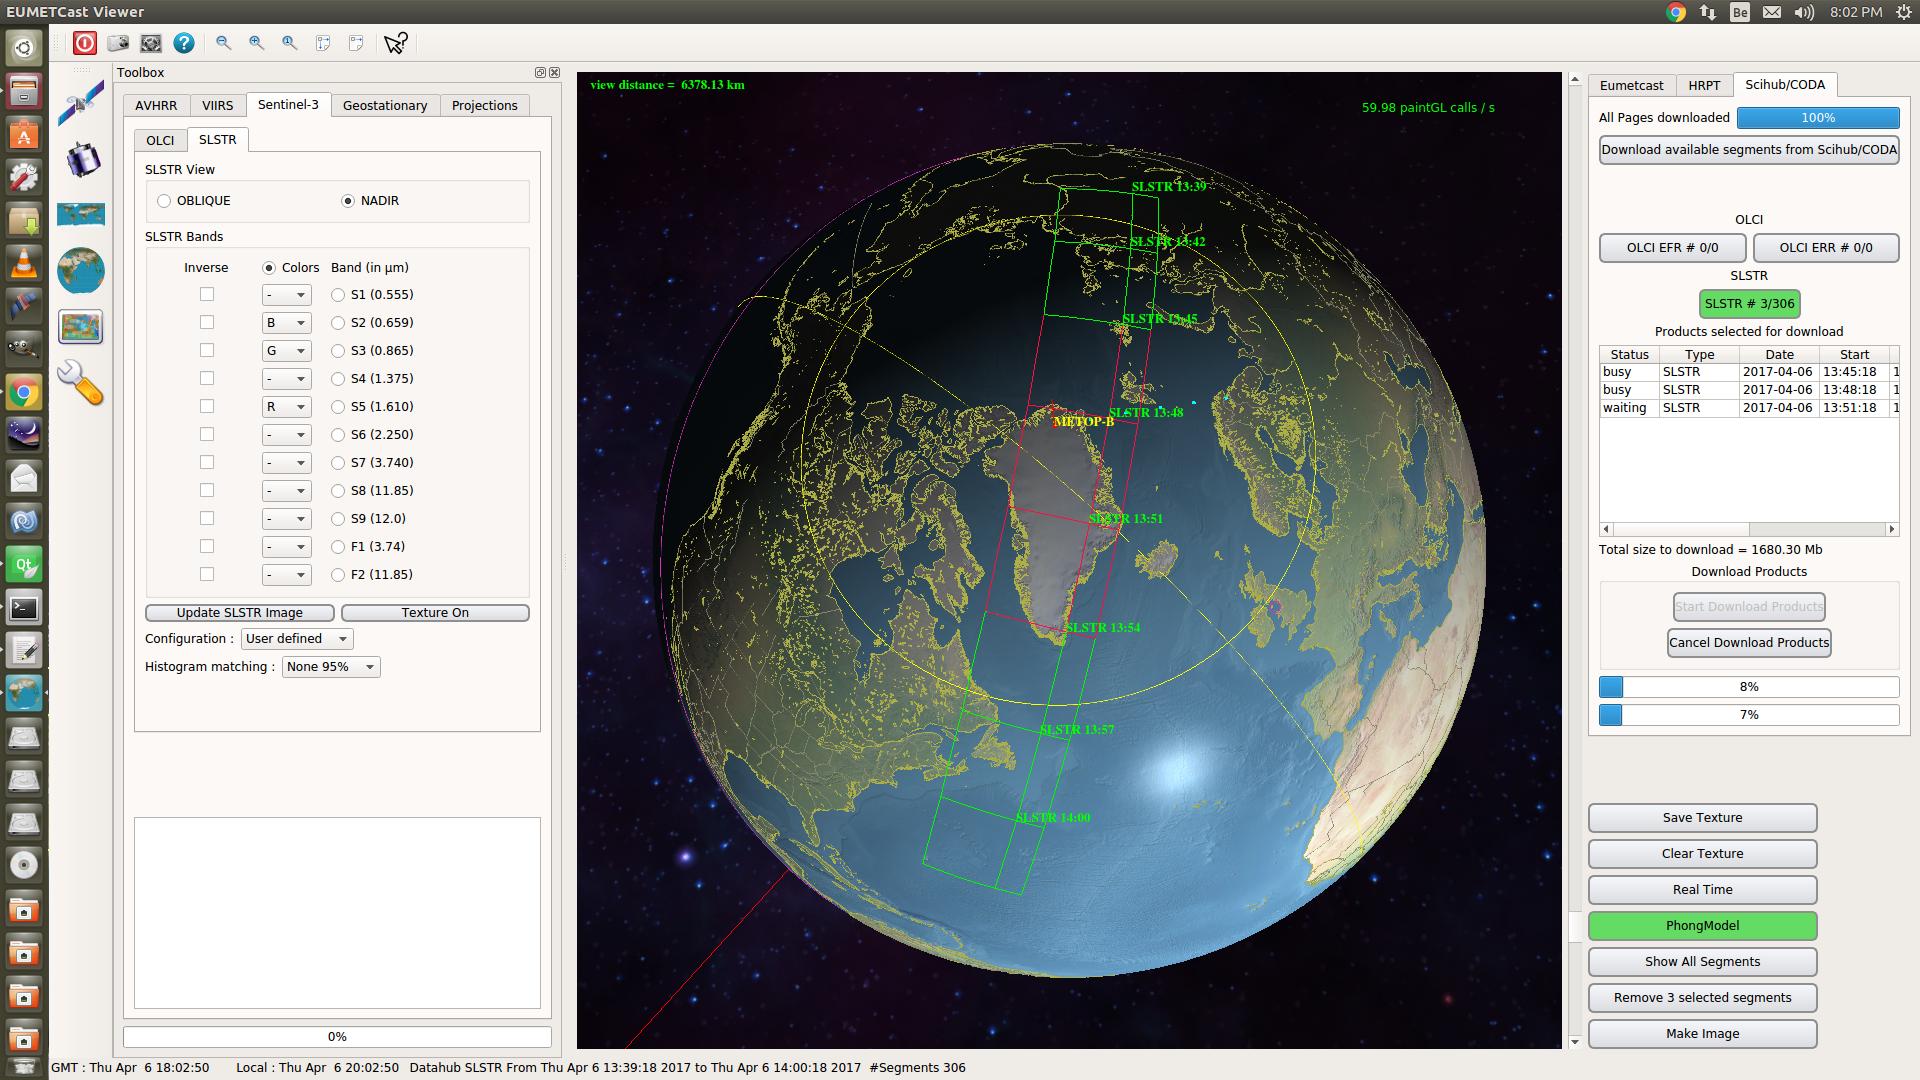
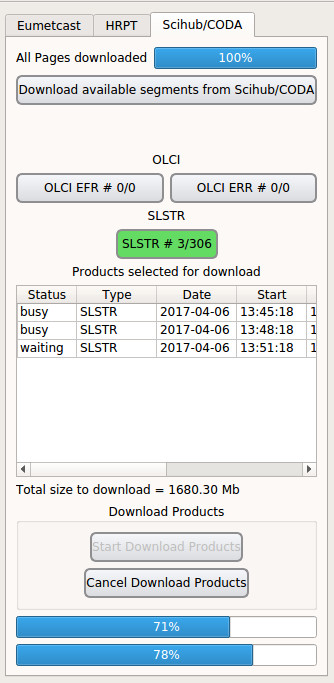
To download the required products, select the segments on the 3D Globe. The selected segments will appear in the list ‘Products selected for download’. The total number of bytes to download is given underneath the list.
To start the download push the ‘Start Download products’ button. Scihub and CODA only allows 2 simultaneous downloads. The status in the list goes from ‘waiting’ to ‘Busy (downloading)’ and finaly ‘Finished’ when the download is complete.
To process the downloaded segments, you have to include the ‘Product directory’ in the ‘List of segment directories’ of the ‘Satellite Setup’ window. The downloaded segments will appear on the 3D Globe where they can be processed as segments coming from Eumetcast.
When starting up EUMETCastView, the program will allways try to find an XML file with available segments for the current day. If the file is not found or the segments are from another date then the current day, nothing is displayed on the 3D Globe.
Download it at Github.
17 Nov 2016
Changes made in EUMETCastView v1.1.6 :
- Decoding and display of OLCI EFR and ERR images from the Sentinel-3A.
Download it at Github.
14 Jan 2016
Changes made in EUMETCastView v1.1.3 :
- Display of False color images from VIIRS for the Brightness Temperature in bands M12 to M16 .
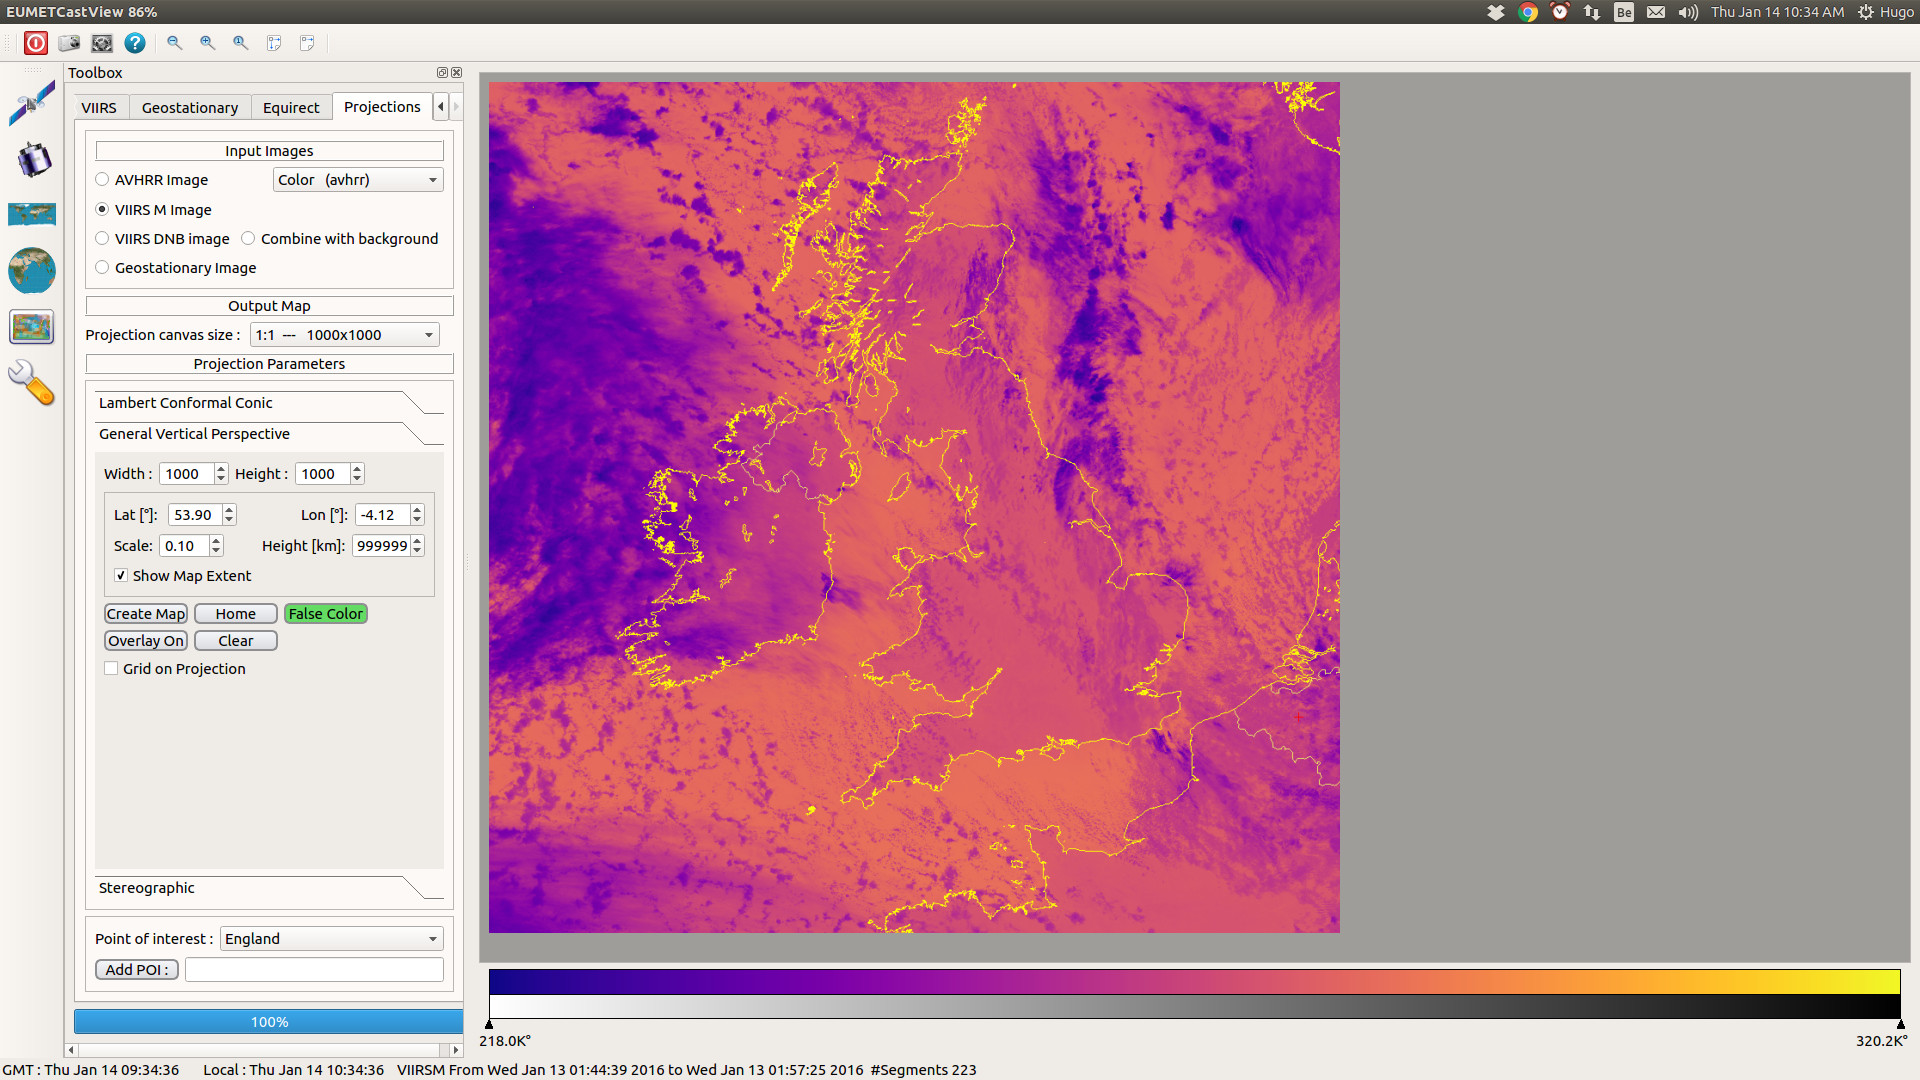
How to use the ‘False Color’ button
Displaying the ‘Brightness Temperture’ in a projection image is only possible for the bands M12 to M16 for VIIRS images. If a monochrome projection image is displayed, the button “False Color” in the ‘Projections’ tab of the Toolbox will change the monochrome image to a color image according to a colormap. In the ‘Preferences - Projection’ dialog box there are 4 different colormaps to choose from.
When the false color image is first displayed the maximum and minimum temperature establishes the boundaries of the colors displayed.
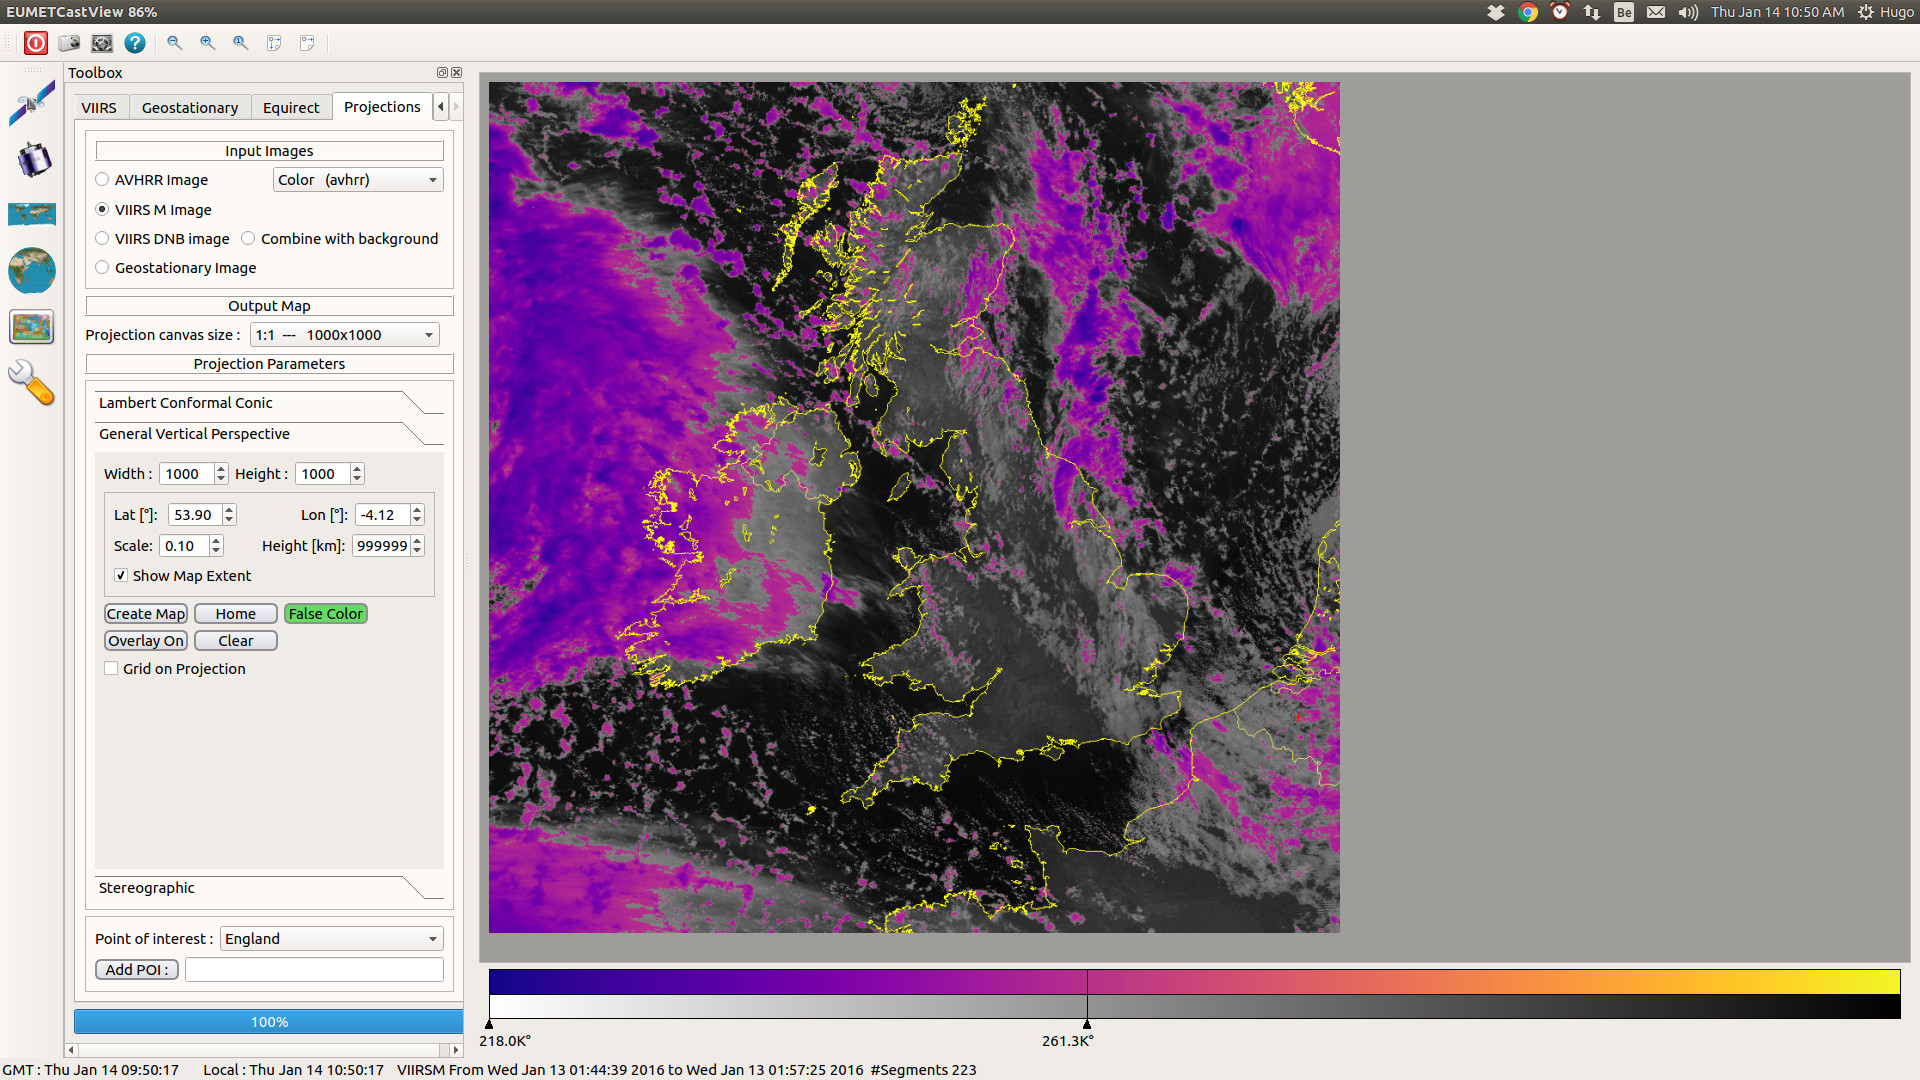
By moving the arrows, only the colors between the arrows are displayed, the rest of the images stays monochrome.
Download it at Github.
29 Nov 2015
Changes made in EUMETCastView v1.1.2 :
- Added a Configuration database for VIIRS M.
- The VIIRS M and VIIRS DNB images have there own image memory, and so it is possible to view the two images together.
- Change of the Projection tab to include the new input image.
- New radiobutton in the Projection tab that allows to combine the VIIRS M and VIIRS DNB images.
- Moved the track buttons vertical to the right and included an overview counter of the selected segments.
How to use the radiobutton “Combine with background”
- In the 3D Globe window select the segments over the area of interest for the VIIRS M band.
- Make the VIIRS M image. Because the DNB segments are always at night, choose for example Blue for M13, Green for M14 and Red for M15.
- Select the VIIRS DNB segements over the same area.
- Make the VIIRS DNB image.
- Go to the ‘Image’ window. You can view the two images by clicking on the ‘M-Band’ tab or the ‘Day/Night Band’ tab.
- Select the ‘Projection’ tab, choose the kind of projection and select the projection area of interest.
- Select the ‘Input Images’ radiobutton ‘VIIRS M Image’ and create the projection map.
- Select the ‘Input Images’ radiobutton ‘VIIRS DNB Image’ and also select the ‘Combine with background’ radiobutton. The background (the VIIRS M image) will be combined with the VIIRS DNB Image.
Download it at Github.
