18 Nov 2015
The following features were added in v1.1.1 :
- Decoding of VIIRS DNB images with geolocation.
- Bilinear interpolation for GAC and Noaa. The interpolation works now for VIIRS (DNB and M band), Metop, GAC and Noaa.
- Points of interest database (POI).
In the projection tab there is now a combobox with a collection of POI’s for the three different projections. Only a few POI’s examples are included when you first start up the program. The button “Add POI” allows you to create a collection of coordinates yourself for the different projections. The POI’s are saved in the file ‘POI.ini’.
In ‘Preferences’ - ‘Projection’ you can view (and update) the database you created.
This release also include the decoding of DNB files. The geolocation data allows you to project the image to LCC, GVP or SG.
Download it at Github.
19 Oct 2015
From the wiki pages :
"Resolution is the capability of the sensor to observe or measure the smallest object clearly with distinct boundaries. There is a difference between the resolution and a pixel. A pixel is actually a unit of the digital image. Resolution depends upon the size of the pixel. Usually, with any given lens setting, the smaller the size of the pixel, the higher the resolution will be and the clearer the object in the image will be. Images having smaller pixel sizes might consist of more pixels. The number of pixels correlates to the amount of information within the image.
The term resolution is often used for a pixel count in digital imaging, even though British, American, Japanese, and international standards specify that it should not be so used, at least in the digital camera field."
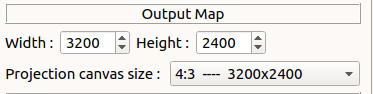
In the toolbox page - projection tab you can change the size of the projection image by changing the width and height. Next to ‘Projection resolution’ there is a dropbox with already defined standard canvas sizes. ‘Projection resolution’ here really means the ‘pixel resolution’ ( there are different kinds of resolution, see the wiki pages ), so to avoid confusing I will change ‘Projection resolution’ to ‘Projection canvas size’ ; it simply means the size of the generated projection image.</img>
For the moment there are three different projections in EUMETCastView ; with the Lambert and the Vertical projections the most important.
From the wiki pages :
"Which projection is best?
The mathematics of projection do not permit any particular map projection to be "best" for everything. Something will always get distorted. Therefore, a diversity of projections exists to service the many uses of maps and their vast range of scales."
</div>
The use for a certain map projection depends on what you want to do with it. For our purposes ( let's produce nice pictures ...) the Vertical projection is maybe the most used.
When you set the height[km] to a very large number for example 1000000 ( 1 million ) then the General Vertical Projection is really an Orthogonal projection.
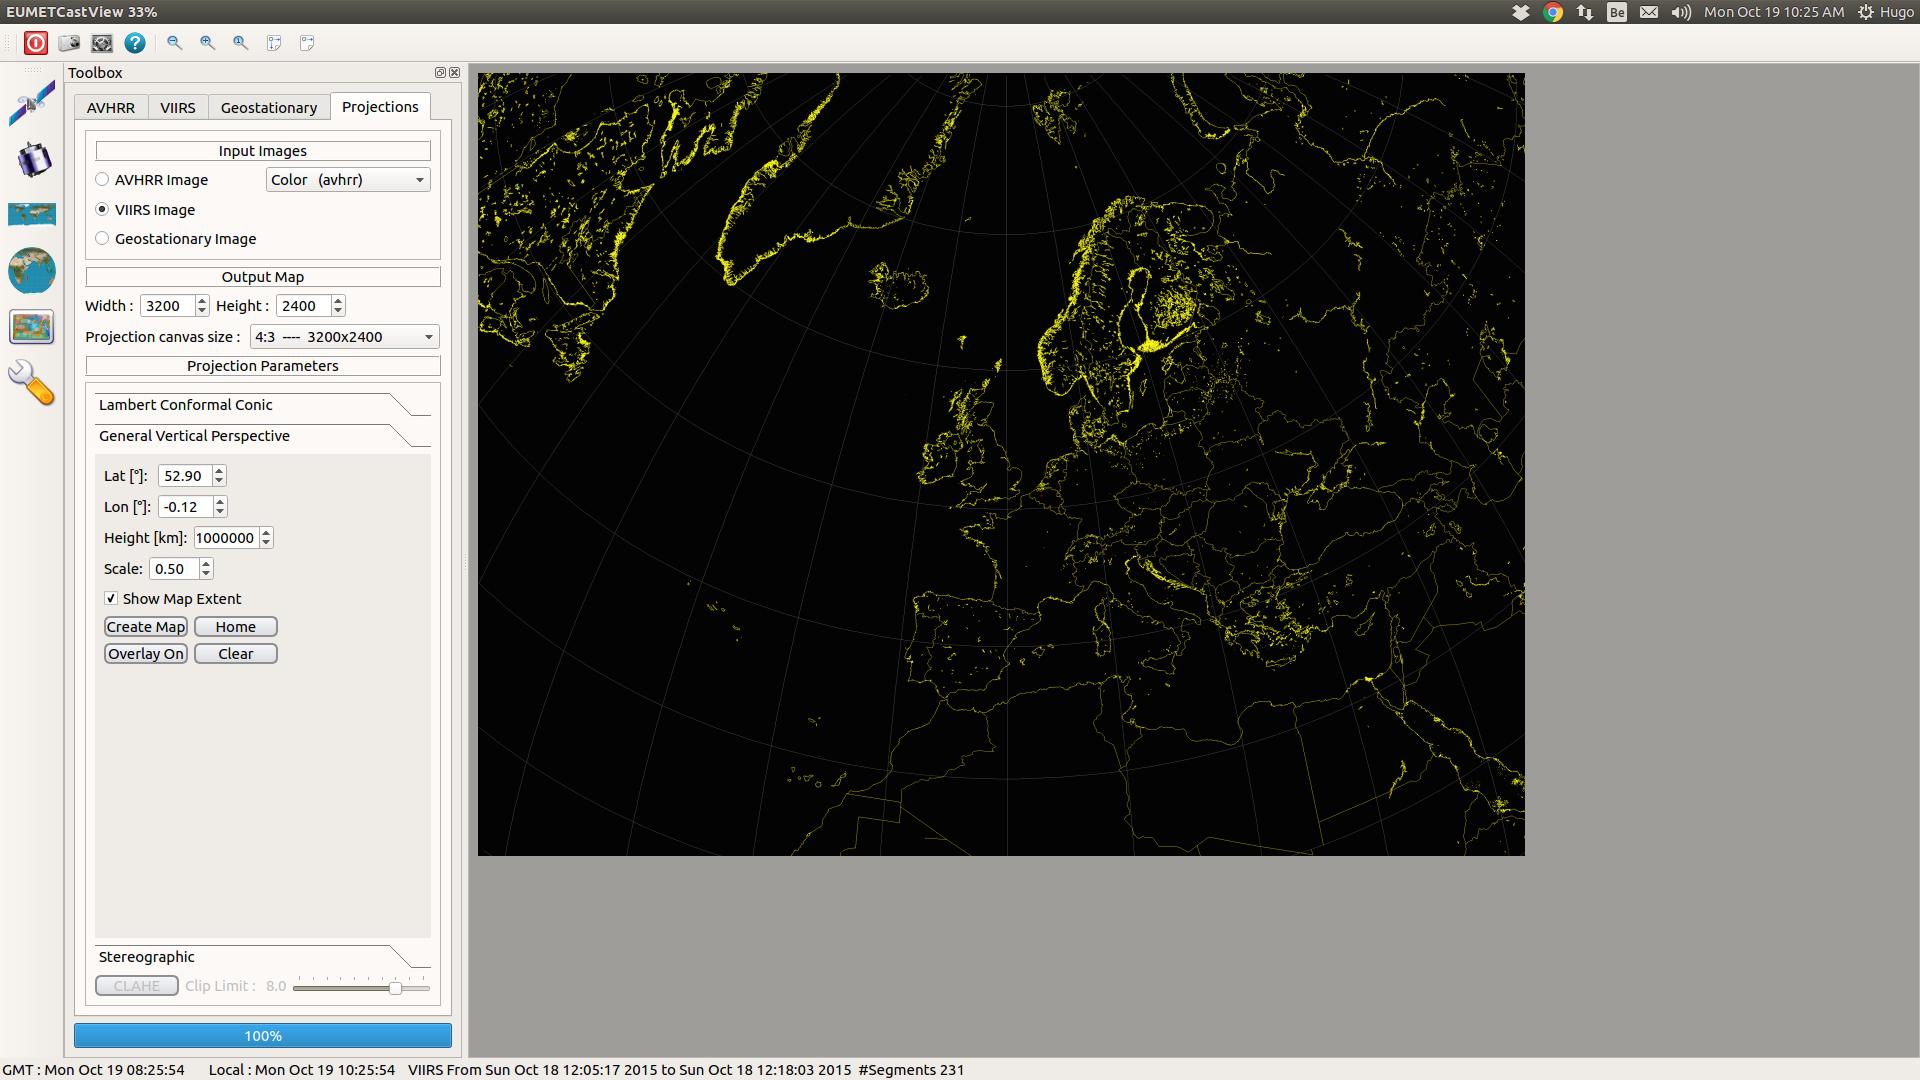
In the screenshot above I set the height to 1 million and the scale to .050 with a canvas size of 3200x2400. I zoomed out to 33% of the image ( the top of the screenshot shows 33 % next to the title of the program ). In this configuration the complete projection image is visible. You can zoom in or out by pushing the buttons "+" or "-" or in or by placing the cursor over the image and moving the mousewheel. To show the image in 'normal size' there is the button "1". This simply means , for a projection image of 3200x2400, that only a portion of the image will be visible (if you have a monitor with for example a screen resolution ( or 'pixel' resolution ... ) 1920x1080 pixels. You can 'pan' the image over your monitor by left clicking and holding the left button down, and moving your cursor.
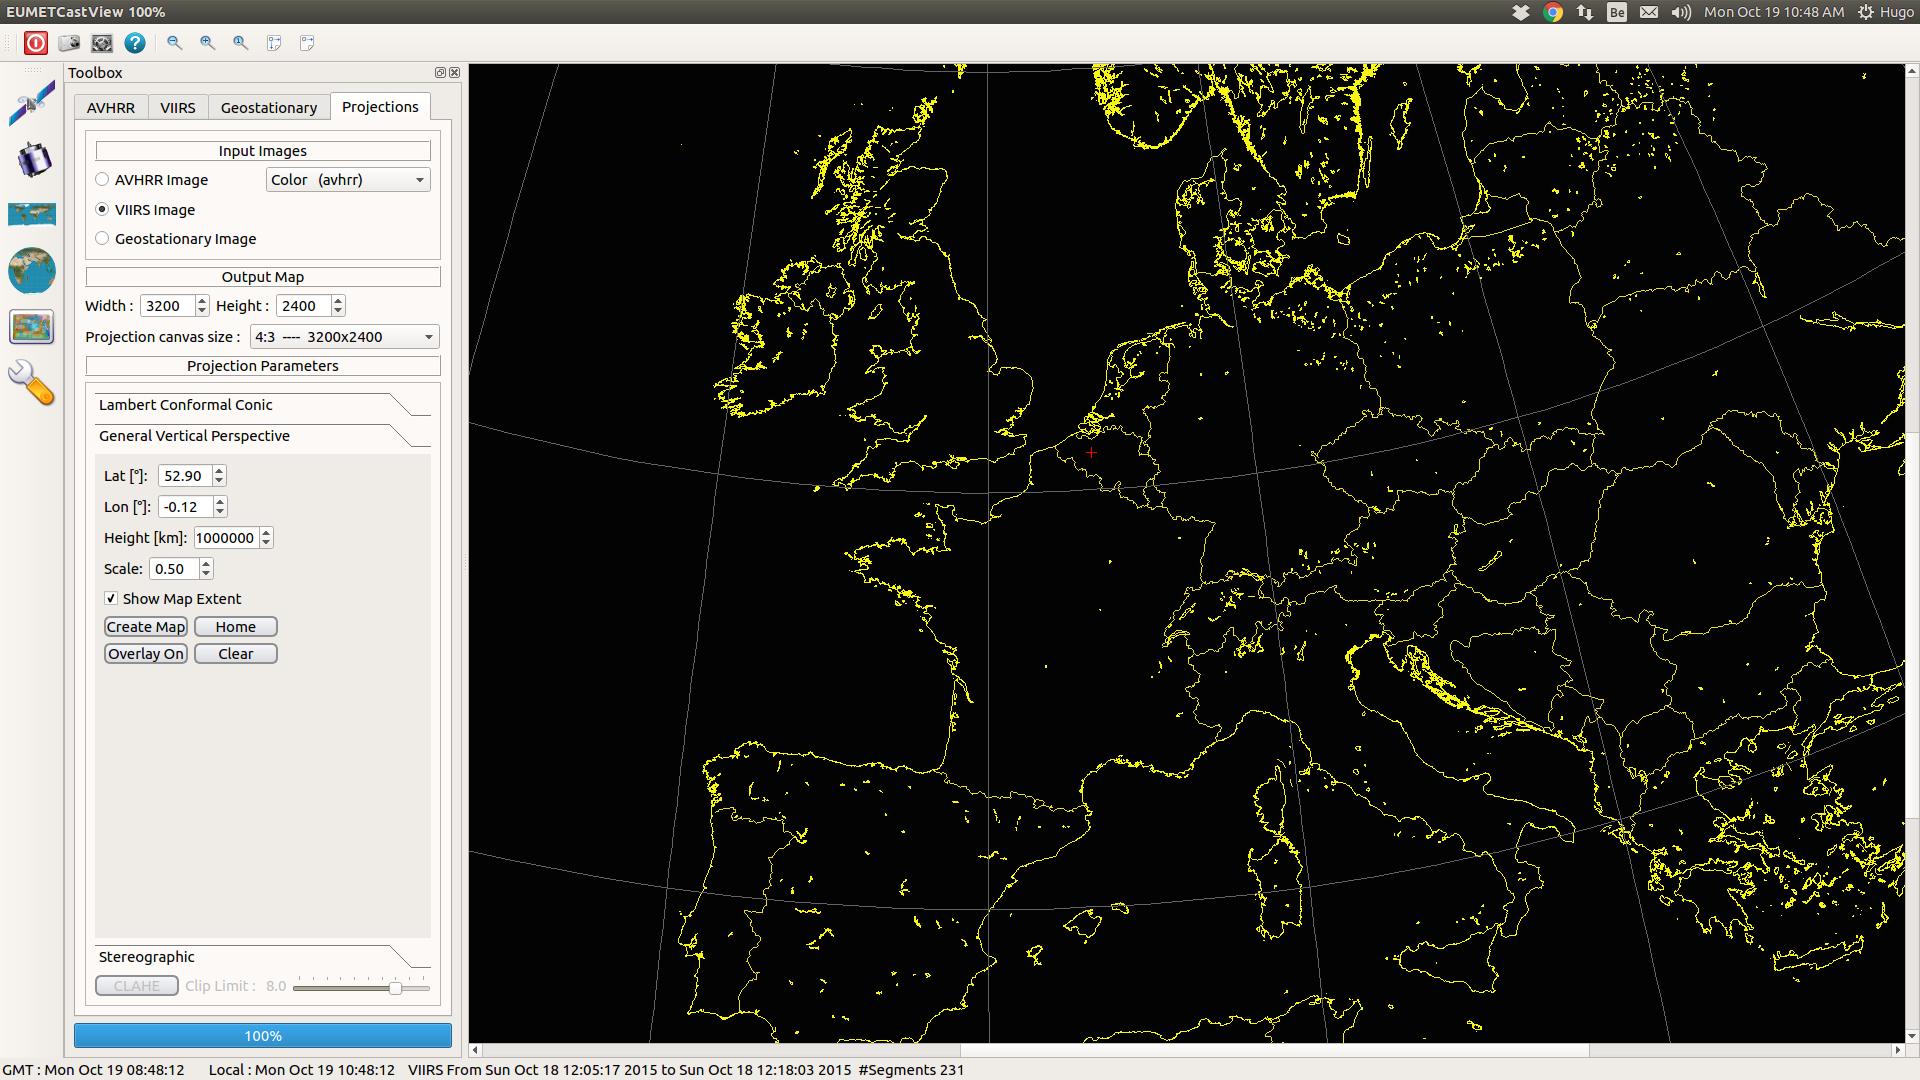
This screenshot shows the same projection but it is 'zoomed' to 100% ( see top of screenshot ). The canvas size stays 3200x2400 and if you would save that projection image, it would be saved in 3200x2400 pixels.
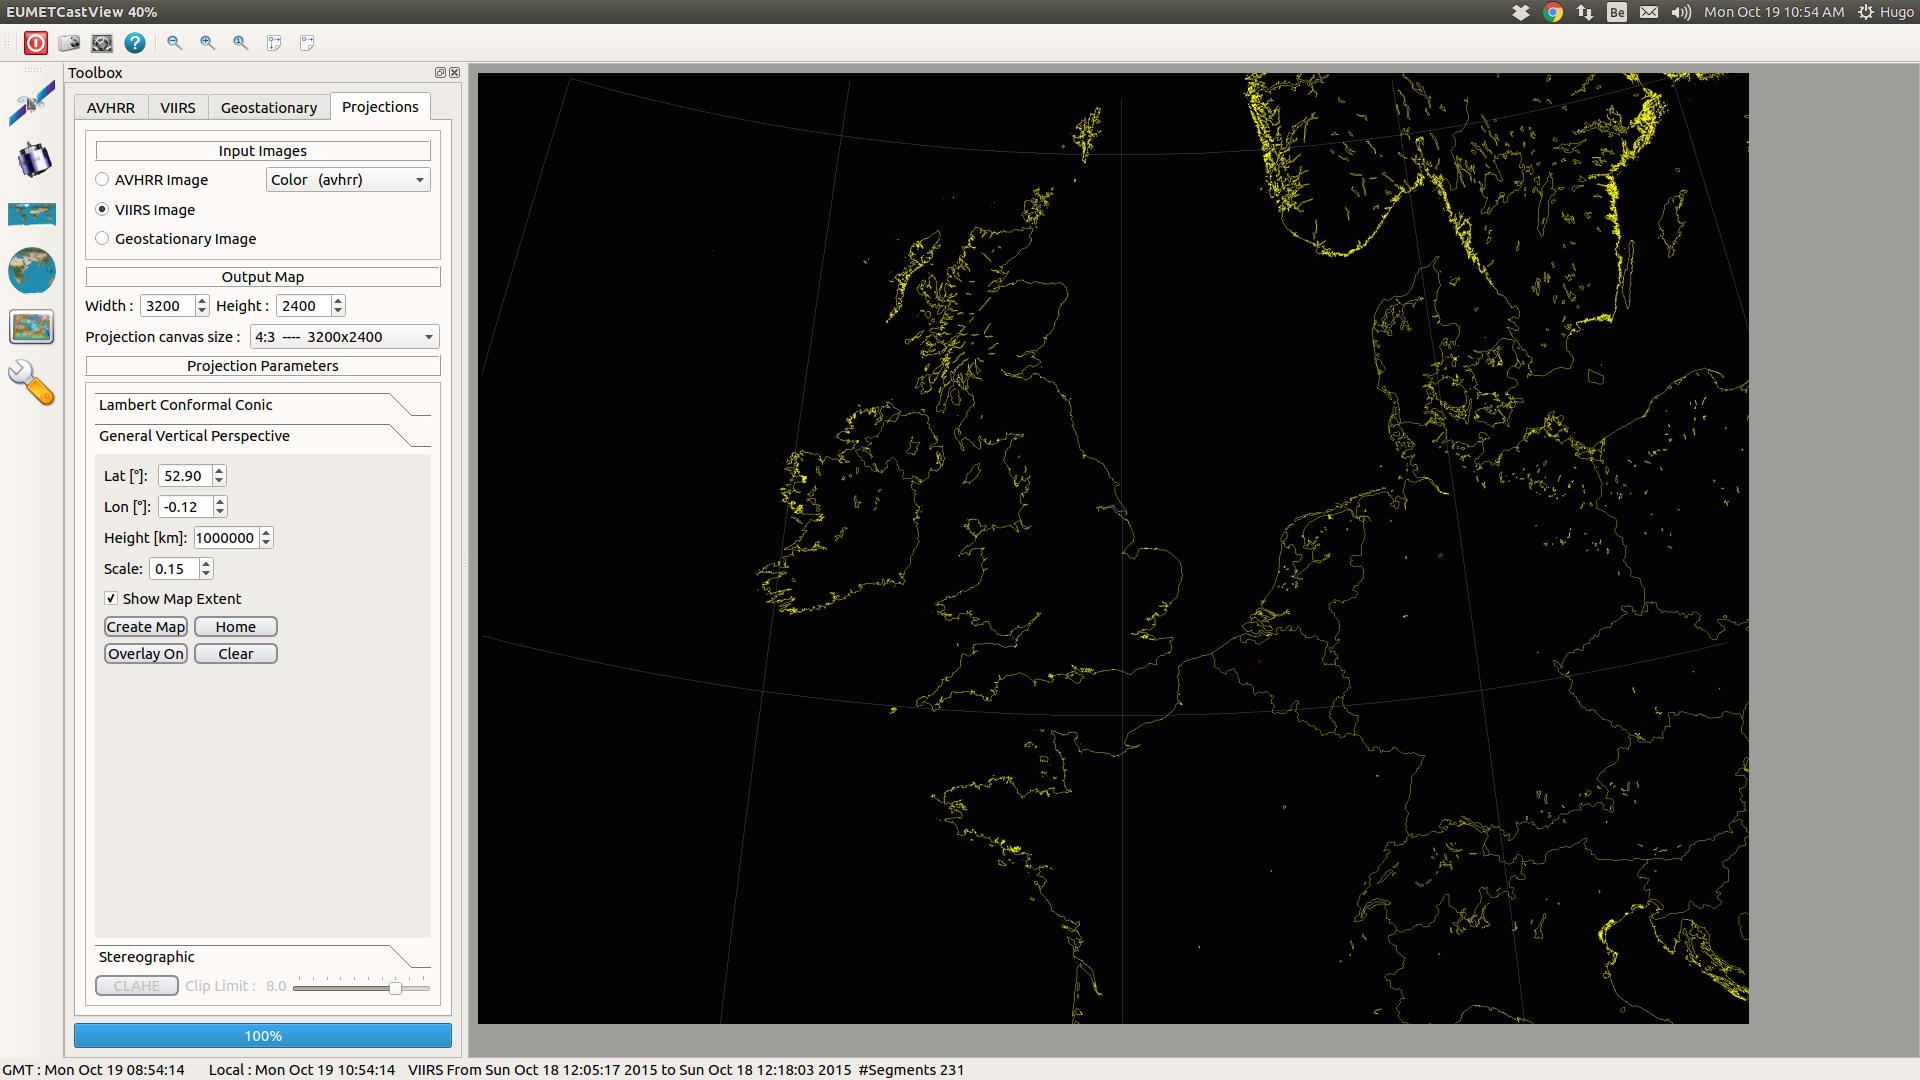
In this screenshot I kept the canvas size to 3200x2400, I 'zoomed' out to 'Fit window' (one of the zoom buttons next to "+, "-" and "1"). This time I changed the 'scale' to 0.15. This really means that I 'zoom' in , in the image itself. This is of course not the same as zooming in or out with the "+" or "-" buttons. This time we are changing the image itself; we show a more detailed picture. The projection image will be again 3200x2400 pixels, but more detail will be visible ( if, of course the input satellite image has a 'pixel resolution' that is big enough ). The AVHRR images has a pixel line resolution of 2048. The VIIRS has a pixel line resolution of 3200. So potentially you could produce a more detailed picture with a raw VIIRS images than with an AVHRR image.
From the wiki pages :
"Spatial resolution.
The measure of how closely lines can be resolved in an image is called spatial resolution, and it depends on properties of the system creating the image, not just the pixel resolution in pixels per inch (ppi). For practical purposes the clarity of the image is decided by its spatial resolution, not the number of pixels in an image. In effect, spatial resolution refers to the number of independent pixel values per unit length.
We can asume that all the pixels in a satellite image are all independent from each other, hence the 'pixel-trim' values in VIIRS images. The pixels that are not independant from each other are filtered out. This will not be entirely the case for Metop, but for the sake of this discussion we will asume that.
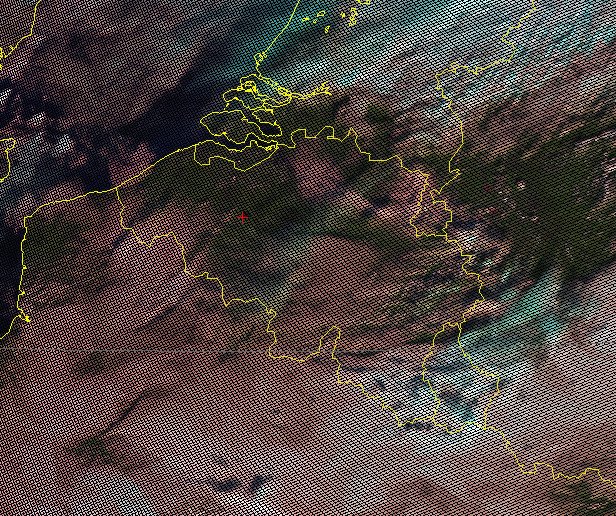
To illustrate the relation between canvas size and the spatial resolution of an satellite image, I created a Vertical projection image of an AVHRR satellite image ( originally it was 1600x1200 ) with canvas size 1600x1200, scale = 0.07 and with the smoothing off. You can see here the individual ( and independent ) pixels in the image and the 'holes' were no image data is available. If you change the canvas size to, for example 800x600 pixels, you would not see the individual pixels and there are less 'holes' in the image.
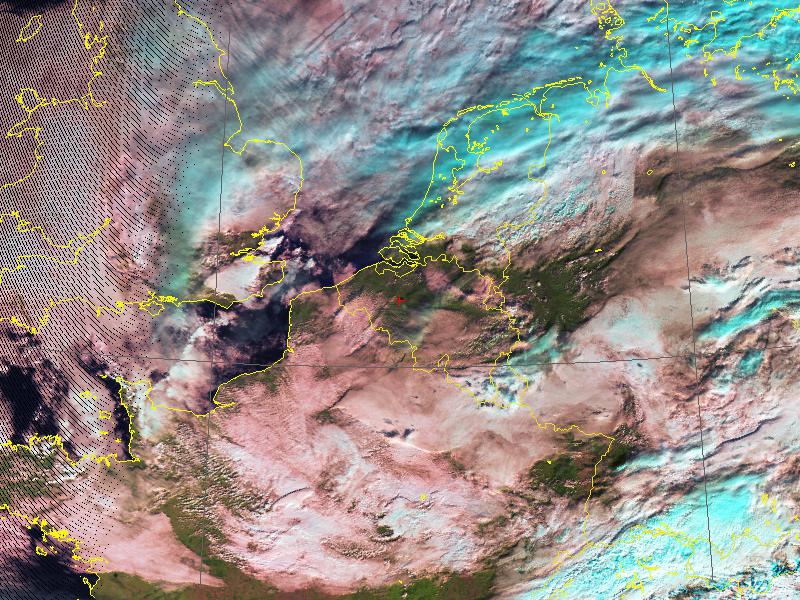
The bilinear interpolation fills up those 'holes' in the projection image. It calculates the mean values of each hole in the picture in relation to the neighbouring pixels.
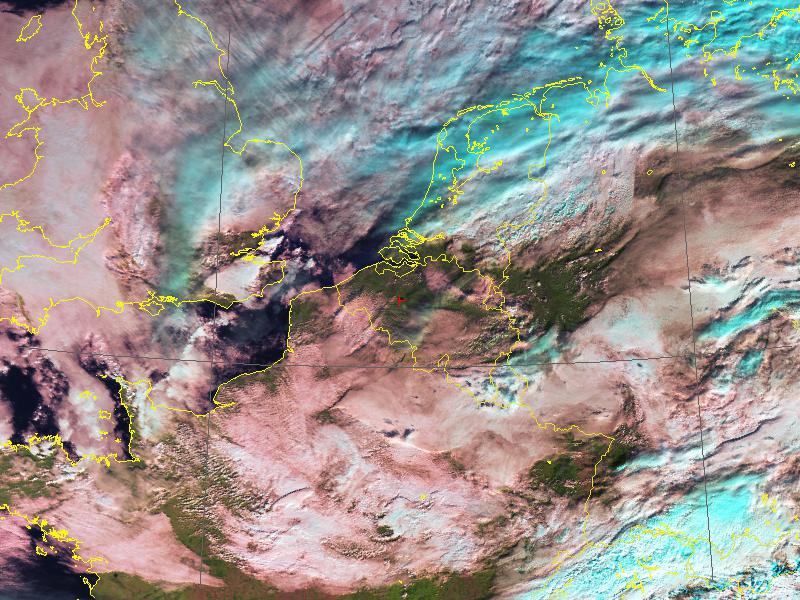
By using a bilinear interpolation you do not 'add' information to the image, but you are able to view 'hidden' information by blowing up the details you want to see.
18 Oct 2015
Since the last release the following changes were made:
- Added projection capability for Himawari-8 images.
- Reading of the datafiles are now compatible with David’s Taylor programs.
- For VIIRS images the geolocation near the poles and dateline works.
- Bilinear interpolation for Metop and Noaa.
Download it at Github.
08 Oct 2015
The following changes were made:
- The program will start with the last selection made for VIIRS and geostationary images.
- The processing of the VIIRS images runs in a worker thread.
- For the smoothing of the VIIRS images a bilinear interpolation algorithm was used.
For using the new smoothing algo you need to set the radio button in Preferences - Image properties - ‘Bilinear interpolation’.
Download it at Github.
25 Sep 2015
In this release v1.0.5 the following changes are made :
- Avoid crashing the application when no TLE’s are selected with warning message
- Added standard resolutions to the Projection tab.
- FengYun image processing running in a worker thread
- In Preferences - Image properties you have the possibility to turn on/off gridlines in the projection image
Download it at Github.
